
Are children an unwanted luxury?

Popular versus unpopular explanations for collapsing fertility rates

The latest accessory

An article last week by Mike Konczal went semi-viral by describing a third child as a luxury good.1[1] Using data from the US Survey of Consumer Finances, Mr. Konczal showed that the top 1% of households by income were more likely to have three or more children than the less affluent. Some were perplexed by this, including perhaps initially Mr. Konczal, though to his credit he explicitly noted that the income-fertility relationship is complex. Many others seized upon his charts as evidence of a fashionable view that the decline in fertility is driven by rising costs of living, particularly young people being left behind in the property market.

So many issues…

There are so many issues to tackle here that I’ll limit myself to four. First, I’ll explain why Mr. Konczal’s finding is not the least bit surprising and is, in fact, the norm in human history. Second, I’ll dispell three misunderstandings that drive at least some of the confusion and misdiagnoses applied to his result. Third, I’m going to debunk the fashionable cost-of-living argument. Finally, I’ll explain why its popularity reflects cognitive dissonance over what I view as the three most likely causes of declining fertility.

Perplexing perplexity

Like surely any anthropologist, biologist or non-Westerner, I am perplexed that anyone is puzzled by one of the most obvious and clichéd truths of human history and evolutionary biology: the rich can (and do) afford more kids. Just as alpha male chimpanzees monopolize breeding rights within their troops, the rich and powerful have done the same in human societies since the dawn of civilization. Incan emperors reportedly received 1,500 women per province, Chinese emperors had harems of 10,000 and Indian rulers were reported to have as many as 16,000 in their harems.2[2] Genetic evidence suggests that Genghis Khan is the paternal ancestor of 0.5% of the world’s male population,3[3] while genealogical studies reveal that wealthy men fathered twice as many children as poorer men over much of English history.4[4] That truism has continued into modern times to such an extent the the authors of one study sheepishly stated it thus, “This finding is not particularly earth-shattering: it is no surprise that people assess their material wealth as part of their decision to have (more) children.”5[5]

Or, WEIRDly confusing?

What is behind the confusion? I suspect it has a lot to do with what Joseph Henrich called “WEIRDness” (Western, Educated, Industrialized, Rich, and Democratic).6[6] Many Western elites live in echo chambers that ring painfully with cognitive dissonance when struck by reality, as I discuss below. (Prepare yourself: it will be uncomfortable for some.) But those echo chambers are reinforced by a few well defined misunderstandings.

Nations aren’t people

The primary source of confusion, acknowledged by Mr. Konczal, is that many wrongly infer within-country income-fertility relationships from cross-country patterns. Rich countries have lower fertility rates than poor countries due to the “First Demographic Transition.”7[7] In the first transition — I’ll get to the second below8[8] — economic development improves health and living conditions, lowering child mortality rates, which allows parents to achieve the same desired number of surviving children with fewer births. Further, when parents are more convinced their children will survive, they tend to invest more in their education, reducing their desired number of children due to the increase in time and resources required. As a result, national fertility rates fall as economic development rises. Yet, within countries at every stage — developing,9[9] industrialized10[10] or post-industrial11[11] — richer families tend to have more children.

Gender confusion

An ancillary source of confusion is worth touching upon. Fertility rates are measured in children per woman for a reason. The most prolific mother in history gave birth to 69 children in 27 pregnancies(!), while the most prolific father in history (reportedly) sired 1,171 children.12[12] While Mrs. Vassilyev’s 69 children (amply) boosted 18th-century Russian fertility, Sultan Moulay Ismail’s monopolization of his hareem likely reduced the fertility 17th century Morocco. Because women, unlike men, are limited to one pregnancy at a time, they determine a society’s fertility rate. But, as Lyman Stone notes, the data Mr. Konczal uses almost surely double-count at least some US women.13[13] Mr. Konczal looks at total children per household (not on a tax-claimant basis), including adopted and step children. Under that accounting, my own blended family — which you can assist into the top 1% with a subscription to Thematic Markets! — is blessed by five children, but in fertility terms it’s only 2.5.

The cost-of- living canard

But the virality of Mr. Konczal’s post was driven by a misconception that is a subtle twist on the nation-for-individual error noted previously. Many took Mr. Konczal’s rediscovery of the wheel as evidence supporting the increasingly common misperception that rising costs of living are driving the fall in fertility rates. But the affordability thesis suffers from two glaring fallacies: a failure to distinguish nominal from real purchasing power and its treatment of childbearing as a primarily economic rather than social choice.

Shocker: rich neighborhoods are more expensive

Let’s start with the first. Somehow people have lost sight of the obvious point that local prices are a function of local income. Without higher incomes to support demand, prices would be lower. This is why high-income countries (and cities) have higher nominal costs. But living standards are determined by real (price-adjusted) income, which is generally higher in richer areas. This should be intuitively obvious: why do people flock to expensive cities for jobs? Because they pay higher real wages. Yes, those higher wages drive housing prices and private-school fees higher, compressing much of the real-income advantage. But that returns us to the truism with which we started: wealthier people are better positioned to have the families they want.
Economic choice?

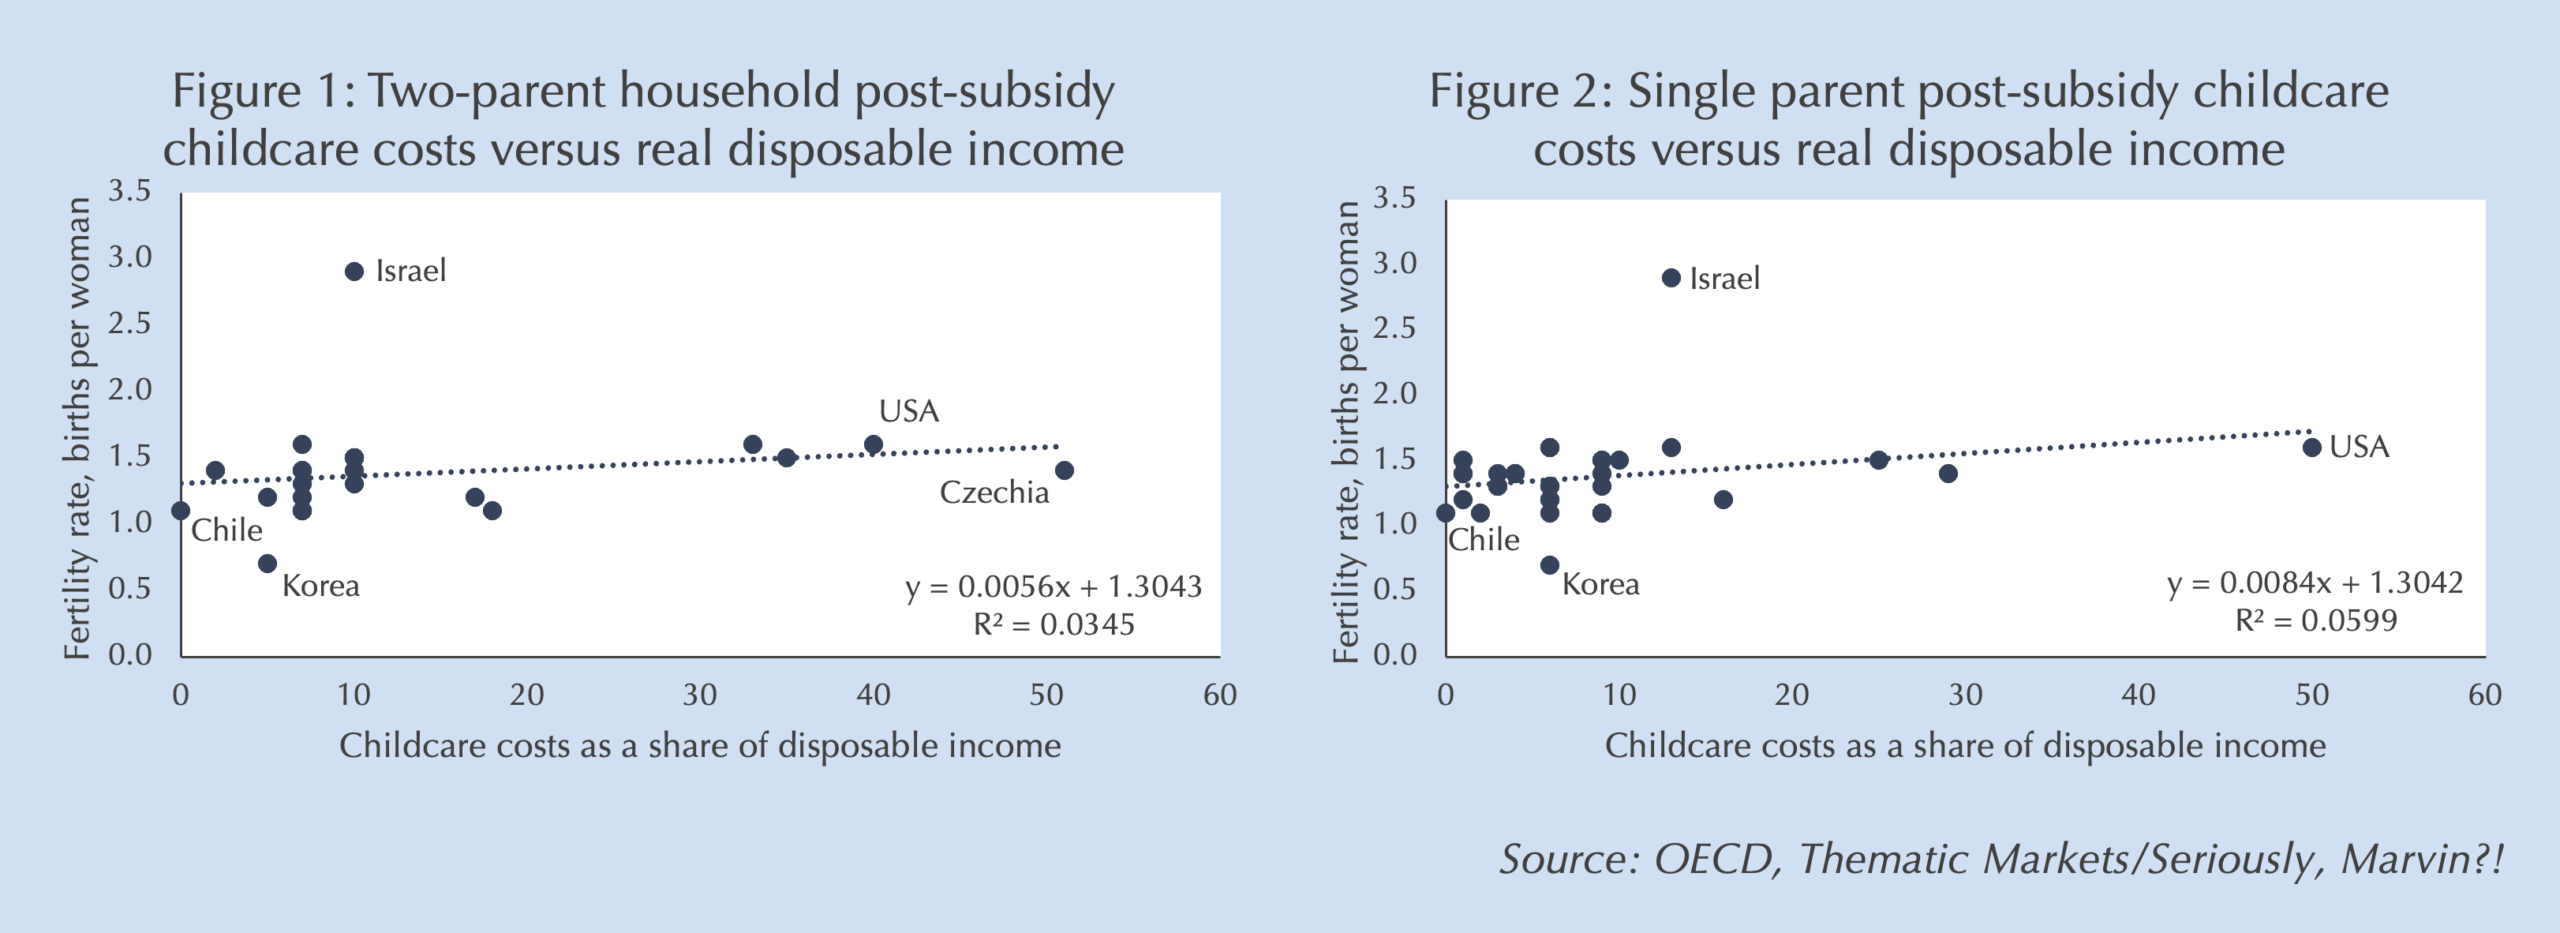
Further, fertility rates aren’t clearly inversely related to the cost of children. Figures 1 and 2 both show the cost of childcare for two children — after state subsidies and tax breaks — as a share of disposable income, Figure 1 for couples and Figure 2 for single parents. Contrary to the cost-of-living hypothesis, fertility rises weakly with at least one direct measure of the cost of childrearing. Admittedly, the causality almost certainly runs the opposite direction: the lowest fertility nations spend the most to subsidize childbearing…but fail miserably because falling fertility is not primarily due economic choice.

Powdered milk, squirrel stew & horse feed

That cost is not the driver of fertility should also be obvious to anyone who reflects on previous generations. I was one of five kids. We shared rooms, wore hand-me-downs, and even drank powdered milk because fresh was too expensive. My mother and her three siblings shared a single bedroom and ate squirrel that my grandfather hunted in the woods of West Virginia. As a small child, her squirrel-hunting father ate rutabagas (horse feed) that he stole from fields outside Hamburg after sneaking out of the (then) walled city after curfew; the one-room tenement he shared with his brother, sister and parents was heated with coke spewed from steam engines he scavenged from along railroad tracks. Despite having real incomes much lower than most Americans enjoy today, my parents, grandparents, and great grandparents chose to have more children. Yours likely did, too.

Hell’s Kitchen versus Suburban Utopia

“But Marvin, they didn’t have to pay for private schools, universities, and today’s housing costs!” I hear you protest. I retort, “Those are choices.” Consider that Manhattan’s population is 38% lower now than a century ago when the Lower East Side squeezed as many 665 people into each acre because most families in the neighborhood then had five or more children.14[14] But we don’t have to travel back in time; we can also see choice’s impact on fertility in its differentials across urban, suburban and rural communities in advanced economies. Suburban and rural communities have 10-15% higher fertility rates than cities in the US,15[15] the same average as for Europe, though for some European countries the difference is as great as 40%.16[16] But intriguingly, a number of studies find that fertility rates are higher in suburbia than either cities or rural areas,17[17] and that remains true even after controlling for income, education and the choice to migrate from cities to suburbs with lower housing costs and quality public schools.18[18] A critical factor driving these results is that urban residents choose to have their children later in life, reducing their overall fertility rate.19[19]

Denialism

My perception is that some of the people leaning on the “cost-of-living” thesis are reluctant to admit that they’re choosing to “live their best lives” over having children. I’m not judging that choice, just making clear that it is a choice. Enjoying the city life in an Instagrammable apartment (with no bunkbeds!) and taking five exotic-locale vacations per year sounds a lot more fun than Olive Garden dinners out, mowing the lawn of your cookie-cutter suburban house, and packing the kids in the station wagon for a road trip to Walley World each summer. Denying the role of choice also evades facing the potential reverse causality in Mr. Konczal’s post: the families with the most kids may have better prepared for their financial future to have kids. Evidence from two studies of the effects of home prices on fertility suggest that may be the case. Even within the same neighborhoods, a rise in house prices boosts the fertility of homeowners while depressing renters’.20[20] No doubt the findings may reflect differences in inherited wealth for some, but it also reflects some families’ prioritization of savings over “best lives” that boosts both wealth and fertility.

The Second Transition and smartphones

There’s evidence for the role of choice in fertility declines in the literature on the Second Demographic Transition.21[21] The collapse in global fertility rates across countries in the last decade cannot be readily explained by improvements in healthcare or greater investment in children’s education. Instead, it appears to reflect what the OECD describes as “Changes in attitudes towards parenthood.”22[22] As popularized earlier this year by John Burn-Murdoch at the Financial Times,23[23] these changes in attitude towards parenting appear to have been accelerated by broadband and mobile telephony,24[24] particularly among lower-education women.25[25] Yet, evidence from Lyman Stone, among others, shows that the effects are not uniform: in some populations mobile telephony raises fertility while it reduces it among others.26[26] The causal mechanism appears to be that women are better informed about how to achieve their desired number of children.

Cognitive dissonance

The Second Transition debate, especially over how smart phones affect fertility, exposes a strong cognitive dissonance among Western elites. What changes in attitudes towards childrearing is mobile telephony propagating? And what decisions is it clarifying for prospective mothers? Three likely factors that are strongly correlated with fertility often get short shrift in popular and policy discussions because they are totems of Western modernity: secularism, divorce and state pensions. Figures 1 and 2 subtly testify to the avoidance: 50% more OECD countries collect data on single parents’ childcare costs (Figure 2) as do for couples’ costs (Figure 1); and the extreme fertility outlier in both charts is the OECD’s only member state defined by its religion.

Secularism

Among countries in the Second Transition, religiosity is among the most strongly correlated with higher fertility, while secularism correlates most strongly with lower fertility. For example, in the US, Mormon families average 3.4 children, evangelical Protestants and Catholics 2.3, atheists 1.6 and agnostics 1.3.27[27] These religious differences persist after controlling for income, education and urbanity, and are similar to those found around the world.28[28] Evidence suggests that religion operates through two powerful channels: culturally it raises the desired number of children,29[29] but it also creates supportive communities that encourage families and facilitate childrearing.30[30] The cultural impact is so great that it appears to trump economic incentives. Not only do religious fertility differences cut across income lines, but a study of Eastern European fertility subsidies found that positive effects were limited to women from religious backgrounds.31[31] Again, secularism has the opposite effects, suppressing even religious minorities’ fertility within secular countries,32[32] and overriding economic incentives to have children.33[33]

Divorce

Religiosity, by culturally reinforcing marriage and family stability, may also reduce the negative effects of lower-cost, no-fault divorce.34[34] A common view among sociologists is that rising female employment facilitated divorce through empowerment, but the evidence points to the reverse: the falling cost of divorce increases married women’s sense of economic insecurity and encourages them into the workforce.35[35] Regardless, the associated increase in marital instability has had a clear negative effect on fertility rates.36[36]

State pensions

The third unmentionable-but-well-documented driver of falling fertility is the rise of state pensions. Children were the original pensions, taking over the family farm or business and caring for parents in their old age. That relationship continued even in urbanized and industrialized societies. But state pensions “emancipated” parents from their own children. The elderly could now rely on the state for old-age support. Yet that support still comes from the next generation through taxation. This creates a serious free-rider problem. If you can rely on others’ children to fund your retirement, you don’t need your own. One study found that the introduction of state pensions in Brazil reduced female fertility rates by 1.3 children.37[37] Studies of similar “natural experiments” across both industrialized38[38] and developing countries39[39] confirm large negative effects on fertility from the introduction of pensions.

Honest policy discussion

To be clear, I am not advocating unwinding of state pensions and modern divorce law, or encouraging everyone to get religion. But misdiagnosis of the causes of falling fertility is costly. We are richer, healthier, better housed, and better educated than any generation in human history, yet have fewer children. Demographic implosion has serious political and economic implications that deserve our attention. Hence, we need to be honest about why young people are choosing to have fewer children despite their measurably better living standards, and design solutions, however unpopular, that address the real problems.

[1] “What distinguishes the 1% from the merely affluent? A third kid.” Mike Konczal, Mike Konczal Newsletter, 19 October 2026. [2] “An Evolutionary and Ecological Analysis of Human Fertility, Mating Patterns, and Parental Investment,” Hillard S. Kaplan & Jane B. Lancaster, in Offspring: Human Fertility Behavior in Biodemographic Perspective, National Academies of Sciences, Engineering, and Medicine. 2003. [3] “The Genetic Legacy of the Mongols,” Tatiana Zerjal et alia, The American Journal of Human Genetics, vol. 72, no. 3, March 2003. [4] “Survival of the Richest: The Malthusian Mechanism in Pre-Industrial England,” Gregory Clark & Gillian Hamilton, The Journal of Economic History, vol. 66, no. 3, 8 September 2006. [5] “Wealth, fertility and adaptive behaviour in industrial populations,” Gert Stulp & Louise Barrett, Philosophical Transactions of the Royal Society B, vol. 371, no. 1692, 19 April 2016. [6] The WEIRDest People in the World: How the West Became Psychologically Peculiar and Particularly Prosperous, Joseph Henrich, London: Allen Lane (Penguin Random House), 2020; and “The Weirdest People in the World?” Henrich, Joseph, Steven J. Heine, and Ara Norenzayan, Behavioral and Brain Sciences, vol. 33, no. 2–3, 2010. [7] “The demographic transition: causes and consequences,” Oded Galor, Cliometrica, vol. 6, 17 February 2011; and “Population, Technology, and Growth: From Malthusian Stagnation to the Demographic Transition and Beyond,” Oded Galor & David N. Weil, American Economic Review, vol. 90, no. 4, September 2000. [8] “Two universal pathways in demographic transition,” Kenji Itao, Evolutionary Human Sciences, vol. 8, 15 June 2026. [9] “On Cultural and Reproductive Success: Kipsigis Evidence,” Monique Borgerhoff Mulder, American Anthropologist, September, vol. 89, no. 3, 1987. [10] “The Reproductive Ecology of Industrial Societies, Part II : The Association between Wealth and Fertility,” Gert Stulp et alia, Human Nature, vol. 27, no. 4, December 2016; and “Resources and the life course: Patterns through the demographic transition,” Bobbi S. Low & Alice L. Clarke, Ethnology and Sociobiology, vol. 13, no. 5-6, September-November 1992. [11] “Fertility decline and the changing dynamics of wealth, status and inequality,” Heidi Colleran et alia, Proceedings of the Royal Society B, vol. 282, no. 1806, May 2015; and “Do high-status people really have fewer children?” Jason Weeden et alia, Human Nature, vol. 17, no. 4, December 2006. [12] From the Guinness Book of World Records:Most prolific mother ever: the wife of Feodor Vassilyev (b. 1707–c.1782), a peasant from Shuya, Russia…gave birth to 16 pairs of twins, seven sets of triplets and four sets of quadruplets; Greatest number of descendants: The last Sharifian Emperor of Morocco, Moulay Ismail (1672–1727), known as The Bloodthirsty, was reputed to have fathered a total of 525 sons and 342 daughters by 1703 and achieved a 700th son in 1721; other studies suggest that his total was 1,171 children. [13] “Are 3-Child Families A Luxury Good?” Lyman Stone, Lyman Stone Substack, 19 October 2026. [14] “History of Crowding,“ Skyscraper Museum, as of 27 October 2026; and “Population of the 100 Largest Cities and Other Urban Places In The United States: 1790 to 1990,” Campbell Gibson, Working Paper Number: POP-WP027, US Census Bureau, June 1998. [15] “Trends in Fertility and Mother’s Age at First Birth Among Rural and Metropolitan Counties: United States, 2007-2017,” Danielle M. Ely & Brady E. Hamilton, NCHS Data Brief No. 323, National Center for Health Statistics, October 2018; and “On the Relationship between Development and Fertility: The Case of the United States,” Igor Ryabov, Comparative Population Studies, vol. 40, no. 4, 11 November 2015. [16] Demography of Europe – 2024 edition, Eurostat, 2024. [17] “Suburban fertility and the role of local contexts in a Mediterranean country: A spatial exercise,” Barbara Ermini et alia, Socio-Economic Planning Sciences, vol. 91, February 2024; and “High Suburban Fertility: Evidence from Four Northern European Countries,” Hill Kulu, Paul Boyle & Gunnar Andersson, Demographic Research, vol. 21, no. 31, 5 September 2008. [18] “Residential context, migration and fertility in a modern urban society,” Hill Kulu & Elizabeth Washbrook, Advances in Life Course Research, vol. 21, September 2014. [19] “Explaining the urban–rural gradient in later fertility in Europe,” Bernhard Riederer & Éva Beaujouan, Population, Space and Place, vol. 30, no. 1, 31 October 2023. [20] “House prices, fertility rates, and homeownership: Evidence from the UK,” Harry Houillon, Natalie Xiaoqi Liu & Helen X. H. Bao, Working Paper 2026-02, Department of Land Economy, University of Cambridge, 2026; and “Do high prices deter fertility? Evidence from England and Wales,” Elizabeth Washbrook, working paper, Centre for Multilevel Modelling, University of Bristol, 2013. [21] “Second Demographic Transition,” Kriti Vikram & Abhijit Visaria, in Gu, D., Dupre, M.E. (eds) Encyclopedia of Gerontology and Population Aging, 1 January 2022; “The Unfolding Story of the Second Demographic Transition,” Ron Lesthaeghe, Population and Development Review, vol. 36, no. 2, June 2010; and “Europe’s Second Demographic Transition,” Dirk J. Van de Kaa, Population Bulletin, vol. 42, no. 1, March 1987. [22] Society at a Glance 2024: OECD Social Indicators, OECD, 2024. [23] “Why birth rates are falling everywhere all at once,” John Burn-Murdoch, Financial Times, 16 May 2026. [24] “Wide and Shallow: Digital Technology and the Post-2007 Fertility Decline,” Nathan Hudson & Hernan J. Moscoso, working paper, University of Cincinnati, 12 October 2026; “Is the iPhone Birth Control? Causal Evidence from AT&T’s 2007–2011 Carrier Monopoly,” Caitlin K. Myers & Ezekiel Hooper, NBER Working Paper No. 35310, National Bureau of Economic Research, October 2026; “The Collapse of Teen Fertility in the Digital Era,” Nathan Hudson & Hernan J. Moscoso Boedo, working paper, University of Cincinnati, 29 April 2026; and “Offline Effects of Online Connecting: The Impact of Broadband Diffusion on Teen Fertility Decisions,” Melanie Guldi & Chris M. Herbst, Journal of Population Economics, vol. 30, no. 1, 14 July 2016. [25] “Decoupled? The Persistent Relevance of Marriage for Childbearing in the 2010s United States,” Kristen Lagasse Burke, Demography, vol. 63, no. 2, 2026; and “The Recent Decline in Period Fertility in England and Wales: Differences Associated with Family Background and Intergenerational Educational Mobility,” John Ermisch, Population Studies, vol. 78, no. 2, 7 June 2023. [26] “Mobile Technologies, Fertility Preferences, and the Calculus of Conscious Choice,” Lyman Stone & Luca Maria Pesando, Population Studies, 11 September 2026; and “Mobile Phones, Digital Inequality, and Fertility: Longitudinal Evidence from Malawi,” Francesco C. Billari, Valentina Rotondi & Jenny Trinitapoli, Demographic Research, vol 42, June 2020. [27] “2023-24 U.S. Religious Landscape Study Interactive Database,” Pew Research Center, 2025. [28] “Secularism and Fertility Worldwide,” Landon Schnabel, Socius, 16 July 2021; “Religiosity, Secularity and Fertility in Canada,” Maryam Dilmaghani, European Journal of Population, vol. 35, 24 April 2018; “Religion and Fertility Ideals, Intentions and Behaviour: A Comparative Study of European Countries,” Dimiter Philipov & Caroline Berghammer, Vienna Yearbook of Population Research, 2007; and “When Does Religion Influence Fertility?” Kevin McQuillan, Population and Development Review, vol. 30, no. 1, March 2004. [29]“Religion, socialization, and fertility,” S G Janssen, R M Hauser, Demography, vol. 18, no. 4, November 1981. [30] “Church attendance and alloparenting: an analysis of fertility, social support and child development among English mothers,” John H. Shaver et alia, Philosophical Transactions of the Royal Society B, vol. 375, no 1805, 17 August 2020. [31] “How religion mediates the fertility response to maternity benefits,” Elizabeth Brainerd & Olga Malkova, Economic Inquiry, vol. 64, no. 2, 18 January 2026. [32] “Secularism and Fertility Worldwide,” Landon Schnabel, Socius, 16 July 2021; and “When Does Religion Influence Fertility?” Kevin McQuillan, Population and Development Review, vol. 30, no. 1, March 2004. [33] A number of studies across Africa show that women generally do increase childbearing when their incomes rise but not when simultaneously advised not to by Western aid organizations; see “Richer women, fewer babies? Not so fast.” Kathleen Beegle & Aletheia Amalia Donald, World Bank Blog, World Bank, 7 July 2026. [34] “Religion and union dissolution: Effects of couple and municipal religiosity on divorce and separation,” Willem R.J. Vermeulen et alia, Demographic Research, vol. 49, July 2023; “Religion and Fertility in Western Europe: Trends Across Cohorts in Britain, France and the Netherlands,” Nitzan Peri-Rotem, European Journal of Population, vol. 32, 28 January 2016; and “Religiosity, Gender Attitudes and Women’s Labour Market Participation and Fertility Decisions in Europe,” R. Guetto, R. Luijkx & S. Scherer, Acta Sociologica, 2015. [35] “Marriage Stability, Taxation and Aggregate Labor Supply in the U.S. vs. Europe,” Indraneel Chakraborty, Hans A. Holter & Serhiy Stepanchuk, Journal of Monetary Economics, vol. 72, May 2015; “Marital Instability and Female Labor Supply,” Berkay Özcan & Richard Breen, Annual Review of Sociology, vol. 38, 2012; “Female Labor Supply and Divorce: New Evidence from Ireland,” Olivier Bargain et alia, European Economic Review, vol 56, no. 8, 2012; and “The Effects of Divorce Risk on the Labour Supply of Married Couples,” Kerry L. Papps, IZA Discussion Paper No. 2395, October 2006. [36] “The Labour Supply of Mothers,” Hélène Turon, IZA Discussion Paper No. 15312, May 2022. [37] “Pensions and Fertility: Microeconomic Evidence,” Alexander M. Danzer & Lennard Zyska, American Economic Journal: Economic Policy, vol. 15, no. 2, May 2023. [38] “What Explains Fertility? Evidence from Italian Pension Reforms,” Francesco C. Billari & Vincenzo Galasso, CESifo Working Paper No. 2646, CESifo, May 2009; and “Pensions, Fertility and Families,” Oskari Juurikkala, Economic Affairs, vol. 27, no 4, 6 December 2007. [39] “The Old-Age Security Motive for Fertility: Evidence from the Extension of Social Pensions in Namibia,” Pauline Rossi & Mathilde Godard, American Economic Journal: Economic Policy, vol. 14, no. 4, January 2020.

Financial Disclosure and Disclaimer

The research, reports, and insights provided by Thematic Markets, Ltd are for informational purposes only and are not intended to constitute financial, investment, legal, tax, or other professional advice. The content is prepared without consideration of individual circumstances, financial objectives, or risk tolerances, and readers should not regard the information as a recommendation to buy, sell, or hold any specific securities, investments, or financial products.

Users of Thematic Markets, Ltd research are solely responsible for their own independent analysis, due diligence, and investment decisions. We strongly advise consulting qualified financial professionals or other advisors before making investment decisions or acting on any information provided in our materials.

The information and opinions provided are based on sources believed to be reliable and accurate at the time of publication. However, Thematic Markets, Ltd makes no representation or warranty, express or implied, as to the accuracy, completeness, or timeliness of the information. Markets, financial instruments, and macroeconomic conditions are inherently unpredictable, and past performance is not indicative of future results.

Thematic Markets, Ltd accepts no liability for any losses, damages, or consequences arising from the use of its research or reliance on the information contained therein. Readers acknowledge that investment decisions carry inherent risks, including the risk of capital loss.

This disclaimer applies globally and shall be enforceable in jurisdictions where Thematic Markets, Ltd, a company incorporated and based in England and Wales, operates. Readers in all jurisdictions, including but not limited to the United Kingdom, United States, Canada, European Union, Australia, Singapore, Japan, South Korea, and Taiwan, are responsible for ensuring compliance with local laws, rules, and regulations.

By accessing or using the research provided by Thematic Markets, Ltd, users agree to the terms of this disclaimer.

Comments are available to paid subscribers only.

Economic and market forecasts:

Economic & market forecasts
  • Sustained higher US rates, vulnerability of backend rates and term premia to steepening in H2 2023: Are we there yet?

  • No recession, continued strength of US economy throughout 2023: Solved: Drivers of the dollar cycle; Clash of the Themes; Are we there yet?; Opportunity knocks: Are you listening?; Götterdämmerung.

  • No backtracking or “pivot” by the Fed in 2023: Solved: Drivers of the dollar cycle; Clash of the Themes; Are we there yet?; Opportunity knocks: Are you listening?; Götterdämmerung.

  • No banking crisis or reversal by the Fed following the failures of Silicon Valley Bank: Did QE cause bank failures? Opportunity knocks: Are you listening?

  • No new “Plaza Accord” resulting from US dollar strength and Fed rate hikes in 2022: Plaza 2.0 bid, not offered.

  • No default by Nigeria before or in the aftermath of the 2023 national elections: Debt reality versus perceptions.

  • The continued fall in US real rates through the 2000s and early 2010s. Themes & framework: Mercantilism (with Chinese characteristics) and the associated $Bloc/Chinese co-prosperity sphere undermined the marginal product of capital in the US while simultaneously increasing non-US demand for US Treasuries.

  • Emerging market outperformance in the 2000s. Themes & framework: Mercantilism (with Chinese characteristics) drove both the development of the $Bloc/Chinese co-prosperity sphere and the commodity supercycle, while Apex neoliberalism supported institutional reforms that lowered EM risk premia, all of which encouraged foreign direct investment that raised productivity and led to rapid economic growth.

  • The end of emerging markets’ “original sin” and growth of EM local bond markets, a development supported by a G7 initiative that I led at the US Treasury. Themes & framework: The $Bloc/Chinese co-prosperity sphere provided a new stability in many EM exchange rates while institutional reforms undertaken by many as part of Apex neoliberalism lowered EM risk premia.

  • The Global Financial Crisis (albeit see admission of errors below). Themes & framework: Mercantilism (with Chinese characteristics) and $Bloc/Chinese co-prosperity sphere simultaneously increased incentives for debt finance in the US (as demand for “safe” USD bonds rose globally) while undermining US means of repayment as the US marginal product of capital in traded goods fell. Combined with poorly designed bank regulation that allowed banks to leverage themselves well beyond regulators’ intent (Apex neoliberalism), “complexity cascaded”.

  • The failure of QE to generate post-GFC inflation. Themes & framework: Believing is being: inflation expectations were stable to falling amid deleveraging and associated lethargic income growth, lowering real interest rates as nominal rates were pinned at the zero lower bound, and implying sustained weak money demand. Stuffing banks with more reserves changed none of those variables. As Keynes described seven decades earlier – in the absence of negative nominal rates – monetary policy at the zero lower bound is equivalent to “pushing on a string”.

  • The lack of effect of balance sheet runoff on interest rates. Themes & framework: Believing is being and portfolio theory rejected the then dominant “portfolio balance” theory of QE. QE was a credible commitment by central banks to keep rates on hold, suppressing expectations for future rates and thus the yield curve. This is why the “Taper Tantrum” had its largest effects on 3-5 year forward rates as expectations for rates hiked rose, while long-dated forward rates fell. Measures of long-dated term premia continued to fall as the Fed reduced its balance sheet.

  • Peak Chinese growth in 2011. Themes & framework: Mercantilism (with Chinese characteristics) led to unsustainable contributions of investment to GDP and a collapse in China’s marginal product of capital amid historically large debt to GDP, a phenomenon that peaked with China’s 50% surge in domestic credit in response to the GFC. Domestic funding of its debt trapped China within its own financial repression scheme, frustrating its efforts to unwind its $Bloc/Chinese co-prosperity sphere and internationalization the renminbi as a closed capital account is required to avoid savings flight and a collapse of the debt bubble. This self-funded debt bubble implies that losses from consequent overinvestment are “amortized” in the form of slower growth.

  • Emerging Market underperformance of the last decade (and likely future decade). Themes & framework: Institutional reform in EM peaked with US policy credibility before the GFC under Apex neoliberalism; China’s peak within Mercantilism (with Chinese characteristics) in 2011 and the associated end of the commodity supercycle ended the “pack” economic benefits of the $Bloc/Chinese co-prosperity sphere, while simultaneously the advent of Localization began to shift production back to advanced economies. Amid stagnating growth and backsliding reforms, EM FX and asset prices looked (and continue to look) overvalued and risk spreads remain too thin.

  • Falling USD reserve share in the 2000s and a rising share since peak China. Themes & framework: The massive reserve accumulation required to sustain undervalution of the $Bloc/Chinese co-prosperity sphere came to be seen as “sovereign wealth” that required diversification, rather than a liquidity store for crises, and led to a consequent fall in the USD share of reserves. Yet the greater financial openness and cross-border claims that accompanied the Apex neoliberalism necessarily implied a proportional increase in capital outflows in periods of risk aversion; i.e. historically large reserves were not as large as perceived in reality. As China and the $Bloc/Chinese co-prosperity sphere slowed after 2011, and Global entropy increased Uncertainty with attendant effects on risk aversion, emerging markets learned painfully in 2014 that reserves were neither excess nor sovereign wealth, but instead necessary liquidity, and that the USD’s safe haven properties were unparalleled.

  • Low and falling inflation throughout the 2010s. Themes & framework: Missingflation, the unexplained trend component of global inflation that had led to two decades of inflation overforecasting by economists, showed no signs of abating and seemed to be caused by a continued slide in inflation expectations (Believing is being) as central banks struggled with the zero lower bound. The end of the trend would require both for central banks to make more credible commitment to raise inflation in conjunction with a sustained positive inflation shock.

  • The (trend) bottoming of long-term US real rates, higher-than-expected peak in Fed funds rates and US equity outperformance in the last decade. Themes & framework: China’s peak in 2011 under Mercantilism (with Chinese characteristics) and the dissolution of the $Bloc/Chinese co-prosperity sphere ended the trend of falling US real rates they had created. But it wasn’t until Localization gathered sufficient steam – and the US private sector had deleveraged – that US openness and technological leadership sufficiently raised US returns to capital to support a rise in US real rates. The Trump administration’s political support (Politics of Rage) for Localization gave another nudge to US relative returns to capital, and Covid again accelerated these phenomena further (and likely more sustainably).

  • The capitulation of Saudi Arabia’s price leadership/management in 2014 in the face of surging US tight oil production leading to lower and more volatile crude oil prices. Themes & framework: The end of the commodity supercycle brought about by peak China under Mercantilism (with Chinese characteristics) paused relentless crude oil demand growth, allowing innovation and a business-friendly US regime to undermined Saudi Arabia’s price leadership with tight oil production. Cartel dynamics combined with Saudi Arabia’s long-run price maximization led to a collapse in Saudi-enforced OPEC discipline, and lower, more volatile crude oil prices.

  • Financial volatility’s shift to a lower median level with more frequent, shorter explosions during the last decade. Themes & framework: Rising Uncertainty in politics (Politics of Rage), geopolitics (Global entropy), technology (Localization), and policy (Missingflation) amid Complexity cascades shifted the relative shares of total risk away from quantifiable sources towards unquantifiable sources; the counter-intuitive implication of rising uncertainty is lower median volatility as active risk taking retreats in information lulls, with violent explosions of price activity when new information is revealed.

  • Persistence of post-Covid supply constraints and sustainable inflation supported by rearview-mirror central bank policies leading to a flip in the direction of Missingflation. Themes & framework: Covid simultaneously accelerated both the economic and political motivations for Localization, caused a permanent shift in the structure of global demand, and disrupted existing global supply chains. Short-run aggregate supply could not adjust to the jump in investment and shift in demand quickly enough, creating prolonged shortages and the need for prices to curtail demand. The associated cost-push inflation was all the spark needed to ignite Believing is being changes in inflation expectation driven by central banks’ backward-looking policies based on a lack of understanding of Missingflation.

  • The Fed’s post-Covid rate cycle would be more like 1994 than the post-2000 gradualist cycles (a call I made in early 2021). Themes & framework: The intent of the Fed’s FAIT policy always was to boost long-run inflation expectations by falling “behind the curve” on inflation. Yet their lack of understanding of the causes of Missingflation and insufficient faith in their own ability to generate Believing is being kept them focused on “fighting the last war” too long, allowing inflation to run too hot, too quickly. But contrary to market conventional wisdom, inflation is deeply politically unpopular in an aging society and no central banker wants to be remembered as failing to control inflation. Accordingly, the Fed (eventually) will react forcefully to contain the Believing is being genie they underestimated.

  • Consistent underperformance of European economy, assets and the euro since the Global Financial Crisis. Themes & framework: Relative to trend growth, Europe was more highly indebted than the US, yet European policymakers too long considered the GFC an “American problem”. Combined with Europe’s greater institutional rigidities and a reluctance to write down bad assets, it would take proportionately longer to achieve necessary deleveraging. China’s 2011 peak within Mercantilism (with Chinese characteristics) and the rise of Localization undermined all parts of Europe: the globalization-dependent South and China-dependent North, while inflexibility and low levels of technological innovation inhibit Europe’s ability to adjust to the new global economic order.

  • UK outperformance of consensus Brexit forecasts. Themes & framework: Consensus forecast for post-Brexit UK were based on three flawed assumptions (due to underappreciation of themes!). First, by ignoring emergent Localization, growth forecasts grounded in Apex neoliberalism wrongly assumed globalization would continue to be a major driver of economic growth. Second, the consensus failed to acknowledge the UK’s long-run structural competitiveness: world-leading universities providing a technological edge in Localization; and strong, enduring institutions offering safety and stability amid Global entropy and rising Uncertainty. Third, the consensus, ironically, ignored the largest driver of trade (by a wide margin) in their own models: “gravity”, or proximity to trading partners. Network effects are extraordinarily powerful in trade and difficult to overcome.

  • Importance and implications for markets of Scottish independence referendum in 2014. Themes & framework: As one of the earliest manifestations of the Politics of Rage and its demands for greater political representation, the Scottish referendum was an unanticipated shock to markets and one of the first signs of Global entropy and the Uncertainty to come.

Global entropy

Manifest and growing disorder

By ignoring the endogeneity of complex systems and Rodrick’s globalization trilemma – that democracy, national self-determination, and economic globalization cannot enduringly coexist – Apex neoliberalism sowed the seeds of its own demise, leading to today’s manifest and growing global disorder: the end of Post-World War II international rules, rising ethnonationalism, multipolarity, the Politics of Rage, and the unwinding of globalized supply chains. In short, Huntington’s Clash of Civilizations trumped Fukuyama’s End of History. Apex neoliberalism facilitated rising trade-to-income ratios, cross-border capital flows, intergovernmental cooperation, and intra-economy income inequality; while simultaneously lowering financial spreads, inter-economy income inequality, and inter-state warfare. Global entropy likely will reverse many of these effects.

Missingflation

Economists don’t understand inflation

What are economists missing about inflation? In the two decades before Covid, market analysts, academic economists and central banks consistently overforecast inflation; in the last two years they have persistently underforecast it. Enduring one-way errors are not “white noise”; they demonstrate bias and strongly suggest that economists’ current understanding of inflation is flawed. Demographics, globalization and technology help to explain some of the forecast miss, but significant omitted variable bias remains, most likely due to failure to explicitly incorporate Believing is being.

Believing is being

Self-fulfilling beliefs are real

Beliefs drive everything from asset bubbles, to debt dynamics, to crypto currencies’ values, to inflation and hyperinflations (probably Missingflation, too). Good economists understand this but often omit beliefs from models to simplify because of the difficulty in measuring beliefs. Unfortunately, too many bad economists copy those models without understanding the potential for omitted variable bias. The rapid social, technological, political, and geopolitical changes behind Global entropy and Uncertainty are swiftly shifting beliefs, driving a feedback loop of economic and political outcomes. Yet the infrequency of these deviations and difficulty in measuring them make statistical modeling nearly impossible. Only through economic theory and full-spectrum information collection can we infer when and how beliefs are adjusting and their likely effects.

Complexity cascades

Complex systems fail unpredictably

Human societies, nation states and (especially) economies are examples of complex systems. Complex systems always operate in “broken” mode and ironically are more structurally stable when they have lots of small failures. But when they are subjected to massive or cascading shocks, complex systems can fail unpredictably and totally. Covid and manifest Global entropy represent self-reinforcing mammoth shockwaves that imply systemic collapses – in all spheres, socio-political, geopolitical, economic, and financial – are more likely than the consensus admits.

Uncertainty

Not all risks can be quantified

All risks are not the same. Some are quantifiable, like the chance of being dealt an ace in a game of cards. Others are not but can be subjectively guessed, like the chance you leave a casino a winner. Then there is uncertainty, the most dangerous of all risks because it is by definition, non-quantifiable: what is the chance the casino gets hit by a meteor? Apex neoliberalism created a façade of quantifiable risks; Global entropy and Complexity cascades are illustrating that the world is far more uncertain. The quantitative models in finance, business, economics, and politics that gained dominance during Apex neoliberalism generally have performed poorly as Global entropy has become more pronounced, a trend that is likely to sustain as uncertainty rises further. Scenario analysis and “satisficing” are the only proven frameworks for dealing with uncertainty.

Politics of Rage

The proletariat want their franchise back

Four decades ago, globalization and increasing economic returns to intellectual capital opened a fissure between elites and everyone else, especially in more developed economies. The economic and political consequences of Apex neoliberalism widened this fissure into a chasm of mistrust that has resulted in the political turmoil that engulfed most advanced economies in the last decade. Contrary to conventional wisdom, its causes derive more from perceived and actual political disenfranchisement than economic distress and inequality. Trends in the former suggest the wave is not near cresting, implying sustained socio-political, geopolitical and economic disruptions.

$Bloc/Chinese co-prosperity sphere

FX herding cures “fear of floating”

The “co-prosperity sphere” of bloc managed exchange rates centered around Chinese trade and the US financial system, alternatively known as Bretton Woods II or Chimerica, dramatically reoriented global supply chains, supported emerging markets’ financial development and economic boom of the 2000s, drove much of the dollar’s 2002-’11 depreciation, and ultimately likely caused the Global Financial Crisis. Emerging market crises of the late 1990s marked the final chapter in the Bretton Woods exchange rate system. Yet “Fear of floating” persisted until China’s Mercantilism and contemporaneous accession to WTO provided an alternative: exchange rates managed by “herd” or by “pack”. Hiding within the herd provided financial stability for China’s EM trading partners, while simultaneously allowing them hunt as a pack for foreign direct investment and supply-chain dominance. The size and rapid growth of the co-prosperity sphere distorted the global economy like a massive stellar object warps space-time. Collective suppression of exchange rates and domestic cost of capital diverted supply chain growth into the bloc, while attendant reserve accumulation led to a surge in demand for “safe” core economy bonds. The former undermined returns to capital in traded goods production outside the bloc and the latter depressed interest rates on “safe” US debt, encouraging overinvestment in non-traded goods like housing. (Note: I labeled this phenomenon “the dollar bloc” when I first wrote about it in 2003-04, but later referred to it as “the co-prosperity sphere”.)

Mercantilism (with Chinese Characteristics)

State capitalism’s unintended costs

China’s 1994-2012 “miracle” that lifted nearly a billion people out of poverty and its current growth problems both originate in its extreme application of the mercantilist “Asian growth model” originated by Japan and later copied by Asia’s “Tigers”. A combination of capital controls, protectionism, domestic financial repression, and industrial policy direct underpriced capital to favored industries that promote rapid capital accumulation and development by leveraging external demand (and technology) from advanced economies. Rapid development and convergence comes at cost, however. Underpriced capital and exchange rates lead to distortive overinvestment. Those losses are realized either abruptly and painfully through write downs – like those enforced on late-‘90s Asian Crisis economies by the IMF – or, if the economy can self fund, are “amortized” as lost future growth. Japan’s lost decade and China’s current funk are examples of the amortization path of economic loss.

Apex neoliberalism

Liberal capital democracy’s pyrrhic victory

Rapid global growth, particularly in the less developed world, “hyperglobalized” production and the growth of inter-governmental coordination derive substantively from the triumph of neoliberalism that followed the collapse of its ideological competitors with the Soviet Union’s fall and emerging market crises of the 1990s. But so too did the seeds of its undoing: The Politics of Rage, Mercantilism (with Chinese characteristics), Missingflation, and ultimately Global entropy. Rapid adoption of Western economic institutions and trade mechanisms followed from neoliberalism’s victory, promoting a world of hyperglobalization: ever-more dispersed but integrated global supply chains, just-in-time industrial processes with reduced redundancy, unfettered cross-border capital flows, and uniform rules that increased the influence of international institutions, non-governmental organizations and multinationals at the expense of local political control and less-skilled citizenry. Resultant uniformity and coincident digitization created a façade of certainty and quantification, promoting an overreliance on quantitative methods in decision processes, risk control and forecasting.

Economic and market phenomena:

Economic & market forecasts
  • The continued fall in US real rates through the 2000s and early 2010s. Themes & framework: Mercantilism (with Chinese characteristics) and the associated $Bloc/Chinese co-prosperity sphere undermined the marginal product of capital in the US while simultaneously increasing non-US demand for US Treasuries.
  • Emerging market outperformance in the 2000s. Themes & framework: Mercantilism (with Chinese characteristics) drove both the development of the $Bloc/Chinese co-prosperity sphere and the commodity supercycle, while Apex neoliberalism supported institutional reforms that lowered EM risk premia, all of which encouraged foreign direct investment that raised productivity and led to rapid economic growth.
  • The end of emerging markets’ “original sin” and growth of EM local bond markets, a development supported by a G7 initiative that I led at the US Treasury. Themes & framework: The $Bloc/Chinese co-prosperity sphere provided a new stability in many EM exchange rates while institutional reforms undertaken by many as part of Apex neoliberalism lowered EM risk premia.
  • The Global Financial Crisis (albeit see admission of errors below). Themes & framework: Mercantilism (with Chinese characteristics) and $Bloc/Chinese co-prosperity sphere simultaneously increased incentives for debt finance in the US (as demand for “safe” USD bonds rose globally) while undermining US means of repayment as the US marginal product of capital in traded goods fell. Combined with poorly designed bank regulation that allowed banks to leverage themselves well beyond regulators’ intent (Apex neoliberalism), “complexity cascaded”.
  • The failure of QE to generate post-GFC inflation. Themes & framework: Believing is being: inflation expectations were stable to falling amid deleveraging and associated lethargic income growth, lowering real interest rates as nominal rates were pinned at the zero lower bound, and implying sustained weak money demand. Stuffing banks with more reserves changed none of those variables. As Keynes described seven decades earlier – in the absence of negative nominal rates – monetary policy at the zero lower bound is equivalent to “pushing on a string”.
  • The lack of effect of balance sheet runoff on interest rates. Themes & framework: Believing is being and portfolio theory rejected the then dominant “portfolio balance” theory of QE. QE was a credible commitment by central banks to keep rates on hold, suppressing expectations for future rates and thus the yield curve. This is why the “Taper Tantrum” had its largest effects on 3-5 year forward rates as expectations for rates hiked rose, while long-dated forward rates fell. Measures of long-dated term premia continued to fall as the Fed reduced its balance sheet.
  • Peak Chinese growth in 2011. Themes & framework: Mercantilism (with Chinese characteristics) led to unsustainable contributions of investment to GDP and a collapse in China’s marginal product of capital amid historically large debt to GDP, a phenomenon that peaked with China’s 50% surge in domestic credit in response to the GFC. Domestic funding of its debt trapped China within its own financial repression scheme, frustrating its efforts to unwind its $Bloc/Chinese co-prosperity sphere and internationalization the renminbi as a closed capital account is required to avoid savings flight and a collapse of the debt bubble. This self-funded debt bubble implies that losses from consequent overinvestment are “amortized” in the form of slower growth.
  • Emerging Market underperformance of the last decade (and likely future decade). Themes & framework: Institutional reform in EM peaked with US policy credibility before the GFC under Apex neoliberalism; China’s peak within Mercantilism (with Chinese characteristics) in 2011 and the associated end of the commodity supercycle ended the “pack” economic benefits of the $Bloc/Chinese co-prosperity sphere, while simultaneously the advent of Localization began to shift production back to advanced economies. Amid stagnating growth and backsliding reforms, EM FX and asset prices looked (and continue to look) overvalued and risk spreads remain too thin.
  • Falling USD reserve share in the 2000s and a rising share since peak China. Themes & framework: The massive reserve accumulation required to sustain undervalution of the $Bloc/Chinese co-prosperity sphere came to be seen as “sovereign wealth” that required diversification, rather than a liquidity store for crises, and led to a consequent fall in the USD share of reserves. Yet the greater financial openness and cross-border claims that accompanied the Apex neoliberalism necessarily implied a proportional increase in capital outflows in periods of risk aversion; i.e. historically large reserves were not as large as perceived in reality. As China and the $Bloc/Chinese co-prosperity sphere slowed after 2011, and Global entropy increased Uncertainty with attendant effects on risk aversion, emerging markets learned painfully in 2014 that reserves were neither excess nor sovereign wealth, but instead necessary liquidity, and that the USD’s safe haven properties were unparalleled.
  • Low and falling inflation throughout the 2010s. Themes & framework: Missingflation, the unexplained trend component of global inflation that had led to two decades of inflation overforecasting by economists, showed no signs of abating and seemed to be caused by a continued slide in inflation expectations (Believing is being) as central banks struggled with the zero lower bound. The end of the trend would require both for central banks to make more credible commitment to raise inflation in conjunction with a sustained positive inflation shock.
  • The (trend) bottoming of long-term US real rates, higher-than-expected peak in Fed funds rates and US equity outperformance in the last decade. Themes & framework: China’s peak in 2011 under Mercantilism (with Chinese characteristics) and the dissolution of the $Bloc/Chinese co-prosperity sphere ended the trend of falling US real rates they had created. But it wasn’t until Localization gathered sufficient steam – and the US private sector had deleveraged – that US openness and technological leadership sufficiently raised US returns to capital to support a rise in US real rates. The Trump administration’s political support (Politics of Rage) for Localization gave another nudge to US relative returns to capital, and Covid again accelerated these phenomena further (and likely more sustainably).
  • The capitulation of Saudi Arabia’s price leadership/management in 2014 in the face of surging US tight oil production leading to lower and more volatile crude oil prices. Themes & framework: The end of the commodity supercycle brought about by peak China under Mercantilism (with Chinese characteristics) paused relentless crude oil demand growth, allowing innovation and a business-friendly US regime to undermined Saudi Arabia’s price leadership with tight oil production. Cartel dynamics combined with Saudi Arabia’s long-run price maximization led to a collapse in Saudi-enforced OPEC discipline, and lower, more volatile crude oil prices.
  • Financial volatility’s shift to a lower median level with more frequent, shorter explosions during the last decade. Themes & framework: Rising Uncertainty in politics (Politics of Rage), geopolitics (Global entropy), technology (Localization), and policy (Missingflation) amid Complexity cascades shifted the relative shares of total risk away from quantifiable sources towards unquantifiable sources; the counter-intuitive implication of rising uncertainty is lower median volatility as active risk taking retreats in information lulls, with violent explosions of price activity when new information is revealed.
  • Persistence of post-Covid supply constraints and sustainable inflation supported by rearview-mirror central bank policies leading to a flip in the direction of Missingflation. Themes & framework: Covid simultaneously accelerated both the economic and political motivations for Localization, caused a permanent shift in the structure of global demand, and disrupted existing global supply chains. Short-run aggregate supply could not adjust to the jump in investment and shift in demand quickly enough, creating prolonged shortages and the need for prices to curtail demand. The associated cost-push inflation was all the spark needed to ignite Believing is being changes in inflation expectation driven by central banks’ backward-looking policies based on a lack of understanding of Missingflation.
  • The Fed’s post-Covid rate cycle would be more like 1994 than the post-2000 gradualist cycles (a call I made in early 2021). Themes & framework: The intent of the Fed’s FAIT policy always was to boost long-run inflation expectations by falling “behind the curve” on inflation. Yet their lack of understanding of the causes of Missingflation and insufficient faith in their own ability to generate Believing is being kept them focused on “fighting the last war” too long, allowing inflation to run too hot, too quickly. But contrary to market conventional wisdom, inflation is deeply politically unpopular in an aging society and no central banker wants to be remembered as failing to control inflation. Accordingly, the Fed (eventually) will react forcefully to contain the Believing is being genie they underestimated.
  • Consistent underperformance of European economy, assets and the euro since the Global Financial Crisis. Themes & framework: Relative to trend growth, Europe was more highly indebted than the US, yet European policymakers too long considered the GFC an “American problem”. Combined with Europe’s greater institutional rigidities and a reluctance to write down bad assets, it would take proportionately longer to achieve necessary deleveraging. China’s 2011 peak within Mercantilism (with Chinese characteristics) and the rise of Localization undermined all parts of Europe: the globalization-dependent South and China-dependent North, while inflexibility and low levels of technological innovation inhibit Europe’s ability to adjust to the new global economic order.
  • UK outperformance of consensus Brexit forecasts. Themes & framework: Consensus forecast for post-Brexit UK were based on three flawed assumptions (due to underappreciation of themes!). First, by ignoring emergent Localization, growth forecasts grounded in Apex neoliberalism wrongly assumed globalization would continue to be a major driver of economic growth. Second, the consensus failed to acknowledge the UK’s long-run structural competitiveness: world-leading universities providing a technological edge in Localization; and strong, enduring institutions offering safety and stability amid Global entropy and rising Uncertainty. Third, the consensus, ironically, ignored the largest driver of trade (by a wide margin) in their own models: “gravity”, or proximity to trading partners. Network effects are extraordinarily powerful in trade and difficult to overcome.
  • Importance and implications for markets of Scottish independence referendum in 2014. Themes & framework: As one of the earliest manifestations of the Politics of Rage and its demands for greater political representation, the Scottish referendum was an unanticipated shock to markets and one of the first signs of Global entropy and the Uncertainty to come.

Foreign exchange forecasts:

Foreign exchange forecasts
  • The dollar’s trend fall 2002-’11. Themes & framework: The effects of the $Bloc/Chinese co-prosperity sphere on relative returns to capital, balance of payments and the effects of “diversification” as sovereign reserves evolved into sovereign wealth.

  • The dollar’s trend turn in 2011, surge 2014-2016, and counter-consensus strength in 2018 and 2021 (I was the only sell-side analyst to forecast USD strength in 2021). Themes & framework: The same forces driving the US real rates higher in the last several years – the end of Mercantilism (with Chinese characteristics) and its associated $Bloc/Chinese co-prosperity sphere, disproportionate benefit to the US from accelerating Localization, Global entropy and Complexity cascades, all played out in the USD, too, with added support from increased safe haven demand for the greenback due to rising Uncertainty brought about by Global entropy and Complexity cascades.

  • The euro’s plunge from $1.36 in mid 2014 to $1.05 in early 2015. Themes & framework: Reluctant deleveraging from the Global Financial Crisis combined with the sharp deterioration in European returns to capital following China’s peak within Mercantilism (with Chinese characteristics) and the shift to Localization from globalization implied a sharply lower real value of the euro. When ECB President Draghi ruled out the deflationary (1990s Japan) path to devaluation with his commitment to “whatever it takes”, Believing is being implied an immediate and massive change in the nominal value of the euro was required as the expected path for domestic prices flipped.

  • The yen’s surge from above 120 per dollar to below 105 in H1 2016. Themes & framework: Abenomics’ biggest success was its Believing is being commitment to reflate Japan’s economy, leading to a sharp depreciation of the nominal yen as expected future deflation was unwound. But yen depreciation included an “overshoot” to compensate for the risks that inflation might overshoot. The Bank of Japan’s tacit admission that “Quantitative & Qualitative Easing” could not create sufficient inflation with its December 2015 adoption of negative interest rates implied a rapid unwind of the overshoot given the yen’s deep undervaluation as beliefs shifted again.

  • The pound sterling’s pre-EU referendum fall to $1.40, post-referendum floor near $1.20, and its post-Brexit rebound above $1.30. Themes & framework: A steep risk premium in sterling was required to compensate for the Uncertainty induced by the Politics of Rage driven jolt. Yet, 1.20 represented a 60+ year low in purchasing power parity and seemed to undervalue the UK’s long-run structural assets – strong institutions, top global universities, leading tech industry – all of which were appreciating in value in a world of Localization, Global entropy, broader Uncertainty, and rising potential for Complexity cascades.

Political forecasts:

  • Political instability in Russia and China in 2023: Clash of the Themes.

  • Brexit 2016. Themes & framework: The chasm between elites (including those in markets) and ordinary citizens over the latter’s sense of disenfranchisement, the fundamental cause of the Politics of Rage, was clear well before the referendum and strongly suggested that bias in polling turnout models could fully account for the polls’ projected margin of defeat.

  • Trump 2016. Themes & framework: Record pre-election postal votes from registered independents (for whom no party seeks to “get out the vote”) suggested that, as with Brexit, the Politics of Rage’s disenfranchised and unaccounted for voters would be sufficient to overcome the (narrow) projected margin of loss.

  • Marine Le Pen’s 2017 success in reaching the run-off but ultimate failure to win French presidency. Themes & framework: The Politics of Rage framework suggested an undercounting of both Le Pen and left-wing populists’ support, giving her a clear path to the second round. But her projected margin of loss in the general election was far too large to be due solely to turnout bias, implying no chance of second-round success, particularly with left-wing populist voters dropping out or shifting support to Macron.

  • Trump narrow loss, post-election conflict 2020. Themes & framework: Pollsters’ mistaken focus on education levels as the source of their 2016 turnout errors rather than on (mis)trust driven by the Politics of Rage implied polls still were biased. Large shifts in minority voters towards Trump and unusually high “undecided” voters late in a highly polarized election also suggested the magnitude of Trump’s outperformance would be large (indeed, it was larger than 2016). But the margin to overcome also was much wider in 2020, suggesting a close loss by Trump. Increasing polarization and mistrust on both sides implied a violent reaction by a minority, whichever side lost.

Admission of errors:

I get things wrong, too, but hopefully am the wiser for it. This list is far from complete, but represents some of the ones that both stung and taught me the most.

  • Failing to specify financial institutions as at risk from credit trauma in 2023. While I did highlight that the most predictable source of for 2023 would be credit events following the massive rise in interest rates in 2022 (Debt reality versus perceptions), I didn’t specifically identify banks and other financial institutions as especially vulnerable, which proved to be the case with the failure of a few regional US banks in March 2023. Lessons learnt: Sometimes one’s focus on the underlying causes blinds to the obvious consequences, and levered entities with broad exposure will always be at risk from any traumas within an economy, even if sector or region specific.

  • Not seeing the Global Financial Crisis sooner. I saw the GFC earlier than many, but the extent of the financial system’s capital shortfall eluded me far longer than it should have. At the US Treasury from 2006 through early 2008 I was responsible for assessing foreign financial risks (sadly, institutional territorialism prevented an integrated approach with my domestic-side colleagues that may have focused more attention on off-balance-sheet financing of US housing). I chaired meeting after meeting in 2006-‘07 with market professionals, academics, regulators, and other policymakers where a noisy minority of participants argued that historic levels of debt to GDP implied an impending crisis. Yet when I challenged them to explain a channel of transmission, what would be the tipping point, why it had not occurred already, or to present evidence that bank capital was insufficient to absorb even an historic drop in US housing prices, none – including some who have become very famous for “calling” the GFC – could do so. Ultimately, it was the behavior of banks in funding markets in mid-to-late 2007 that clued me in that banks’ capital bases might not be what they purported (or, equivalently, contingent liabilities off balance sheet were far larger than people understood). What I had not done – nor, apparently had any of the “experts” I consulted in those years – was the detailed micro-level analysis that the protagonists of The Big Short had done (kudos to them). Lessons learnt: 1. “Macro” analysis often requires “micro foundations”; 2. many people claim expertise, don’t rely on it without evidence; and 3. notwithstanding (2), even if they can’t explain it, pay attention when a gathering minority claim to smell smoke. (Implicit lesson 4: don’t assume that the left hand is talking to the right hand in any organization.)

  • Losing my nerve at the bottom of markets in 2009. My framework helped me to correctly call the bottom in credit markets in January 2009 and recommend to the distressed debt fund I then worked for that we aggressively buy leveraged loans. But on market research mission in late February, I got spooked by US Treasury and Fed officials I met in New York and Washington. Throwing my framework out the window, on 6 March 2009, the exact day the S&P 500 hit its 666 low, I wrote a memo urging the fund to sell SPX futures as a hedge on its market exposure. Lessons learnt: 1. Never abandon your framework; and 2. don’t assume someone’s position or pedigree alone gives them an informational or analytical advantage: demand reasons and evidence.

  • Missing the euro’s partial rebound in 2017; indeed, I forecast it lower! I failed to acknowledge the extent of the uptick in economic activity, and importantly, the credit growth that the ECB’s “anything it takes” policy was generating. This one stung as I was a strong believer in then-President Mario Draghi’s approach and had previously highlighted credit expansion as a key metric of success. Lessons learnt: Keep your eyes on the ball and regularly check to see if any of the ex ante conditions established for changing your mind have been met.

  • Dollar weakness in summer 2020. Another one that really stings. Having correctly forecast that Covid-induced Uncertainty would lead to a surge in the USD as everyone scrambled for high-quality assets and liquidity in March-April 2020, I then failed to incorporate the unwind of that flight to quality as risk tolerance returned once the panic subsided. Lesson learnt: Sadly, the same as 2017 dollar lesson: Keep your eyes on the ball and mind your pre-established conditions for turning points.

  • I completely missed the Fed’s mini easing cycle in 2019. While we will never know and Covid eviscerated my chance at redemption, I still believe the Fed’s easing was not merited and likely would have necessitated more aggressive hiking later had the Covid crisis not intervened. The US economy continued to grow strongly in 2019, investment held up, and while headline inflation moderated somewhat, bottlenecks were generating rapid acceleration in a number of CPI subcomponents. But even if I was right on the economy, the FOMC sets policy and I failed to listen to them, particularly the increasing support for average inflation targeting. Lessons learnt: Policymakers set policy, listen to them even if you think they’re wrong.

  • Underestimating Jeremy Corbyn in the 2017 UK general election. I expected a small Conservative victory based on then Prime Minister Theresa May’s outreach to the working class and the Labour Party’s anti-Brexit tone. What I failed to notice was that Mr. Corbyn’s grass-roots campaign cleverly focused on local bread-and-butter issues and greater political devolution, directly addressing one of the primary drivers of the Politics of Rage: a widening sense of political disenfranchisement among the average citizenry. Corbyn’s tangible policies and outreach – which he largely abandoned in his losing 2019 campaign – easily trumped Ms. May’s intangible rhetoric as “hidden” Brexit voters didn’t trust her. Lessons learnt: Again, “macro” analysis needs “micro foundations”, particularly in politics; ignore at your own peril.

  • Texas Governor Rick Perry to win the 2012 Republican nomination and beat President Barack Obama in the general election. The foundations of the Politics of Rage were already well apparent by the 2012 election and Rick Perry’s campaign was well tuned to court the rising sense of disenfranchisement of working-class voters, particularly in Appalachia, and increasing distrust of institutional expertise across voters. Many of those voters were Democrats who were disappointed with the lack of “Hope and Change” promised by President Obama, making him vulnerable to any Republican who could attract a significant number of Democratic voters. Governor Perry’s bigger challenge appeared to be winning the Republican nomination, but his solid conservative credentials and popularity in the second-largest state suggested he would eek it out. Who knew he would self-immolate in a nationally televised debate? Lessons learnt: Themes are important – Trump proved the Politics of Rage four years later – but idiosyncratic risks always are present.