
Poverty gets more expensive
Everyone is talking about Michael W. Green’s $140,000 poverty line. Many people sent his article to me as supporting evidence for the Politics of Rage. But I was more intrigued by how his analysis relates to the mysterious divergence of data from popular views on the economy and inflation. Long-time readers know that my analysis shows a booming US economy, yet popular angst is palpable. Explaining that divergence partly inspired The Politics of (Mamdani) Rage. Popular ire at inflation may seem less of a mystery given that inflation clearly is out of control, but it is an enigma. Most measures of inflation-adjusted income are rising, suggesting that it isn’t a life-style-threatening assault on cost of living but instead is an annoying reordering of nominal deck chairs. Yet intense inflation anger supported President Trump’s election win last year and now is crushing his approval ratings.
Kudos, Mr. Green
I’d like to start by commending Mr. Green who has taken a lot of unfair criticism. While personal experience suggests that his $140k threshold for “participation” (or $94k in Lynchburg, Virginia according to his subsequent analysis) seems too high, his basic thesis that a “Valley of Death” created by US taxation and welfare policies is oppressing the middle class is compellingly supported (and agrees with my preconceptions). Most of the attacks on his work betray both evidence of a failure to read completely his (now five)11articles on the topic and a mean-spirited defensiveness that says more about his critics than Mr. Green’s analysis. Most importantly, Mr. Green doesn’t just describe a problem, he offers solutions while his critics just hurl rocks. I have some different views on both the underlying sources of the problems and their solutions, which I may tackle in the future, but that takes nothing away from his excellent effort. Kudos.
Confused about inflation
That said, one aspect of the public discourse on Mr. Green’s thesis has piqued me: a misunderstanding of what inflation is and how it is created. Wrong-headed thinking on inflation is a long-standing bee in my bonnet, but in this case relates to some of my thoughts on why inflation without apparent real-wage losses inspires such anger. Mr. Green’s analysis clarified some ideas rattling around in my head. But to explain how I need to start with the difference between “cost of living” and inflation, and what really drives inflation.
Inflation ≠ cost of living
Although they are commonly confused, inflation is not the same thing as a change in the cost of living. Inflation refers to a change in the price of everything, or in economist-speak, general prices. Cost of living instead refers to a change in relative prices: one or more goods relative to wages (or other goods’ prices). Suppose that you live in a two-person economy with only two goods, apples and cherries, and you are the only apple farmer and your neighbor is the only cherry farmer. Suppose further that you and your neighbor run the central bank, and just for fun, you double the money supply by magically doubling your bank account balances. Since neither the supply of apples nor cherries changed, the universal rise in money available just doubles the prices of both apples and cherries. Nominal prices change but nothing real does. You get twice as much money for your apples as before, but the cherries you buy cost twice as much, so neither your real (inflation-adjusted) income nor consumption changes. Same for your neighbor. This is generalprice inflation and explains why I would expect annoyance but not necessarily anger at it.
It’s all relative
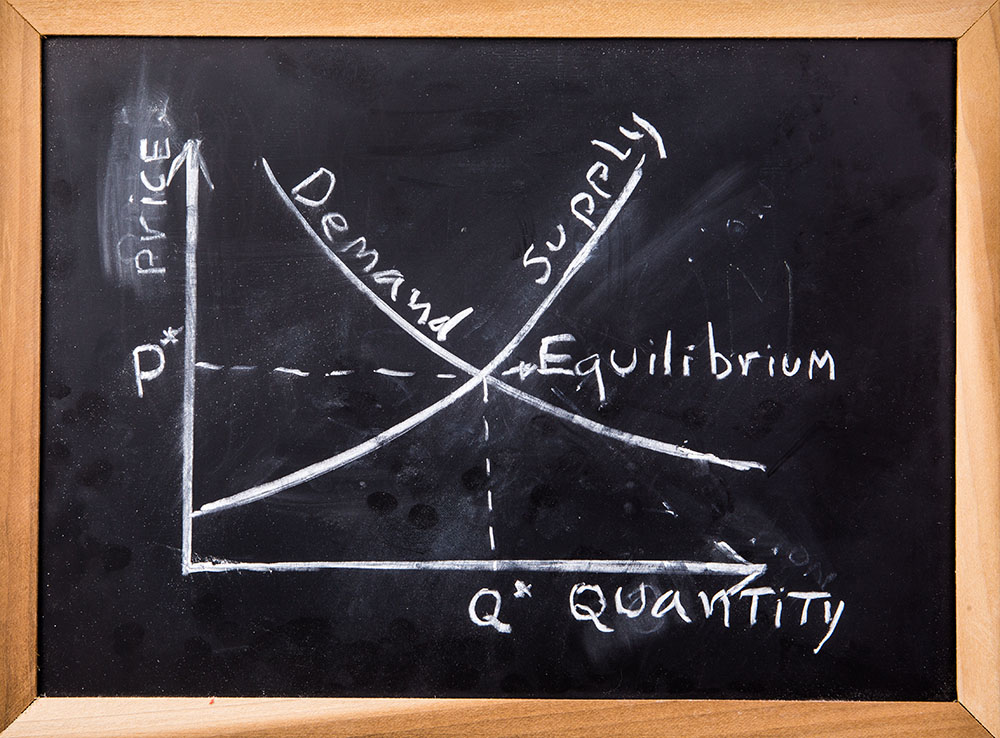
Suppose instead that one of your neighbor’s cherry trees dies, so this year he has fewer cherries to sell you. Your appetite didn’t change, so your demand for his cherries is unchanged. The combination of unchanged demand and fallen supply will raise the market-clearing price of cherries. But nothing happens to the price of apples since neither your neighbor’s demand nor your supply of apples changed.22 The result is a real change in the relative price of cherries versus apples. Since your “wages” (apple revenue) fall relative to the cost of your consumption, it represents a positive shock to your cost of living and you consume less. You and your neighbor can again agree to double (or halve) the money supply, but that won’t change the relative price of cherries or the rise in your cost of living. This is relative price inflation and when you are on the wrong side of it you have something to be angry about: less cherries.
Relative prices are irrelevant for inflation
Now let’s free that bee in my bonnet. Nothing drives me crazier than when some analyst – I can forgive lay people, but professionals?! – explains that Covid inflation was caused by “used car” prices, or falling “owners’ equivalent rent” would lower inflation. How’d those forecasts workout for y’all? There’s a reason why I am one of the only people across markets who correctly forecast the persistent fall in inflation in the last decade, its post-Covid rise, and its persistence over the last two years: I know that relative prices are irrelevantto inflation. Think about a simple CPI basket with only the prices of apples and cherries in it, equally weighted: P = PA + PC. What does the ratio PA/PC tell you about P (or changes in P, i.e. inflation)? Nothing. That’s math: two equations with three unknowns have infinite solutions.
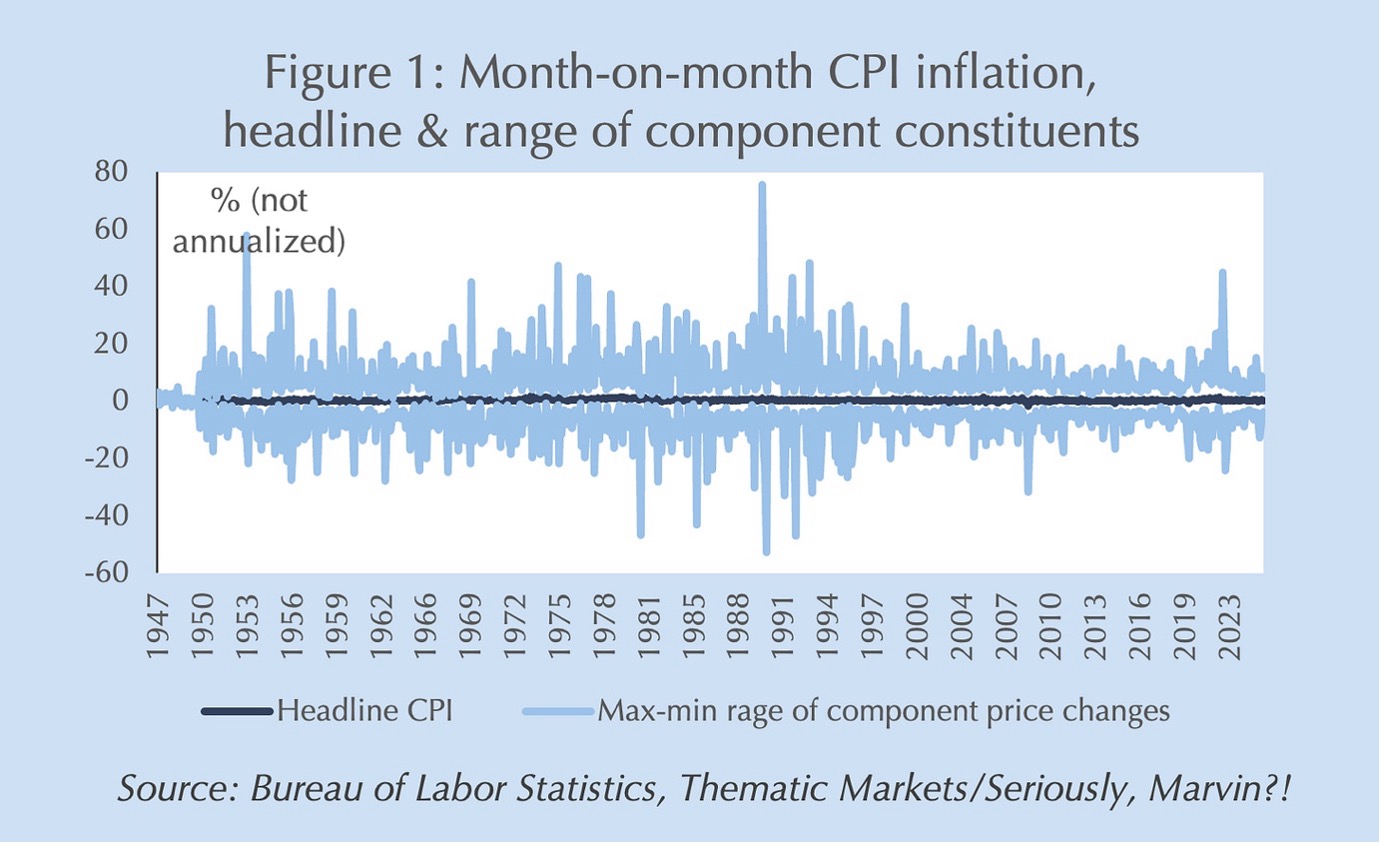
Test your favorite “analyst”
Still don’t believe me? Figure 1 presents the range of month-on-month changes in CPI subindices (not individual prices, which are even more volatile, but sub-baskets of prices within the headline CPI basket). The range can be massive: plus or minus 60 percent nonannualized. I’ll be blunt: anyone who attributes past or future inflation to that noise is strongly demonstrating their complete ignorance of both math and economics.33 Yet, this “analysis” is shockingly common not just on X or CNBC, but from Wall Street economists…and even central bankers. (A decade ago, I published an analysis showing that all these groups’ inflation forecasts had persistent, forecastable errors, something that should be impossible if they knew what they were doing.)44
The expectations anchor
So, if all these experts are wrong, what drives inflation then? Expectations.55 This is the heart of Being is believing. In a speech I gave a few years ago that is freely available at Thematic Markets, I explained how consumer and producer inflation expectations generate inflation (note carefully: not bond market expectations derived from inflation-indexed bonds or inflation swaps). For now, just assume that I’m right: if consumers and producers share an expectation that inflation will be πe = p, then actual inflation, πe, will be p (or thereabouts). If you don’t like math accept one more thing on faith: if I can set inflation expectations, πe, and I know that apple inflation, πA, and cherry inflation, πC, rarely ever fall below zero, then I can bound the relative price inflation of apples versus cherries, πA/πC, i.e. changes in costs of living.
“Participation” prizes
Now I can begin to explain how Mr. Green’s insights help explain why people are angry about inflation despite a measured rise in real wages (i.e. wages rising faster than inflation). One of Mr. Green’s key insights is the effects of rising threshold prices in what he calls “participation” goods. For instance, expanding two-factor authentication for many goods and services now make a smart phone an essential rather than luxury good for most modern denizens. Hence it matters little that a mobile phone today can do more than your computer a decade ago if the cheapest mobile service costs more than your landline from 40 years ago. That minimum price becomes a threshold for “participation” in the economy: holding a job (car), raising kids (house), even surviving (healthcare). As Mr. Green puts it “rapid inflation of non-discretionary costs (housing, childcare, healthcare, unadjusted for quality to reflect actual cash outlay)…is [creating] an arithmetic failure” for many household budgets.
“Number Go Up!”
Now think about how the “Number-Go-Up Rule” affects relative prices. Shareholders like numbers that go up and punish severely the stock price of any firm that prints negative numbers. Imagine that you’re the CEO of a company facing a negative relative price shock for your product. It could even be for a good reason: productivity gains mean that you can now build last year’s smart phone for half the cost. Because of the “Number-Go-Up Rule” you can’t even think about cutting your price. You would much rather freeze your price and amortize the negative relative price shock through time as other prices rise, or if your costs are falling, add new features to your product. For “participation goods,” this means prices never fall even when costs are.
Slow boiling frogs
The combination of Number-Go-Up effects and low inflation in the last decade helped to hide these effects on household budgets just as if slow boiling a frog. Recall my assertion that if I can set inflation expectations low and if many individual prices in the economy are effectively bounded at zero (by the Number-Go-Up Rule), then I can bound relative price effects, too. Before Covid, inflation expectations were not only low, they were falling, leading to the decade’s “Missingflation.” With many companies resistant to negative prices – remember when central banks insisted we were at risk of deflation? Hah! – many relative prices were constrained from fully adjusting. In our apples and cherries economy, if general price inflation was pinned at 2% or less, then if the apple farmer won’t cut prices, cherry prices can’t rise more than 4% even if the fundamentals suggest a relative price increase of 10%.66
Turning up the heat
What happens if central banks, in their valiant effort to prevent the terrible threat of deflation, turn up the heat and actively encourage inflation expectations to rise? “Participation” in the economic jacuzzi that was beginning to get a bit uncomfortable suddenly becomes unbearable. Not only does the bound containing rising relative prices relax, but many of those firms that had been holding their prices flat begin to sense a now-or-never opportunity to make the Number Go Up rather than just not be negative. Threshold prices for a wider variety of “participation” goods begin to bite.
Evidence from relative price behavior
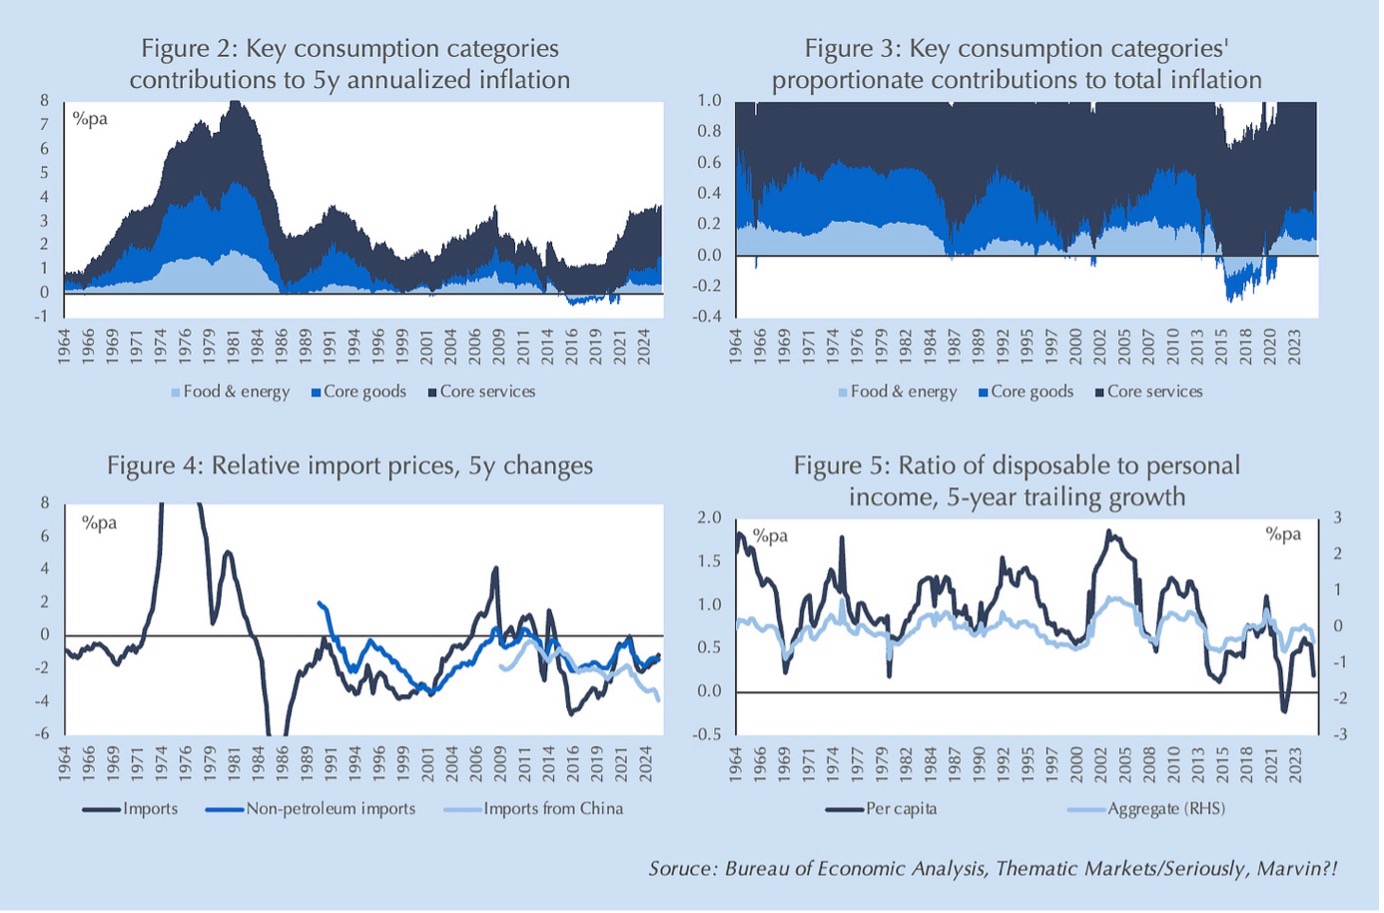
Breaking down relative price inflation for goods, services and inflation provides strong suggestive evidence that this is exactly what has happened over the last decade and a half. Figure 2 deconstructs inflation over the last six decades into three component “relative” prices: core service prices, core goods prices and food and energy prices that tend to be both more volatile and inelastic.77 One immediately striking feature of the graph is that periods of low inflation are dominated by rises in service prices, i.e. the prices of products that are less traded across borders.
Number Go Down?
That trend becomes even clearer in Figure 3, which presents the same data as proportions of total inflation: as inflation trended lower from the 1980s through the 2010s, core service prices’ contribution to inflation becomes increasingly dominant to the point that by the Missingflation period more than all of the rise in consumer prices was attributable to services as food, energy and goods prices all fell. As inflation expectations continued to fall the disinflationary effects of falling relative prices for traded goods became so intense that it began to break the Number-Go-Up Rule. (Wasn’t that terrible?! So glad that the Fed saved us from that terrible fate.) But nontraded goods – services – still filled the remaining gap, slow boiling consumer frogs and explaining why Mr. Green specifically enumerates “housing, childcare, [and] healthcare” costs as the focus of pain.
Proof made in China
The proof of these effects comes from Chinese import prices in the post-Covid period as the Fed turned up the boil. I note that Mr. Green and I both agree with Michael Pettis that China’s industrial policies are forcing its domestic surplus on the rest of the world, relentlessly pressuring traded goods prices lower. As shown by Figure 4 that pressure has been a key driver of the collapse in US domestic goods price inflation that, in turn, led to service price dominance. I’ve purposely aligned Figure 4’s dates with Figure 2 above it to illustrate that even before China – Japan in the ‘80s, Asian “Tigers” in the 1990s – collapsing US goods inflation has been driven by the industrial policies of its East Asian trading partners. There are two notable exceptions: the beginnings of the “Great Inflation” in the late 1960s and the post-Covid period. Falling import prices in the 1960s didn’t stop accelerating US domestic goods price inflation as the Fed allowed inflation expectations to gallop out of the stables.
Let’s try it again!
Fortunately for posterity, we can now be sure that wasn’t a fluke. Jerome Powell’s Fed decided to repeat the experiment and, surprise, got the same result despite Chinese import prices accelerating to the downside. This puts paid to the lie that supply constraints were responsible for post-Covid inflation rather than the Fed’s proactive stoking of inflation expectations. But the sharp increase in the contribution of domestic goods prices to US inflation amid flat overall import prices and falling Chinese import prices provides suggestive evidence that lifting the lid on inflation expectations allowed both a rapid “catch-up” in previously constrained relative prices and a reach for Number-Go-Up revenues even on goods with falling costs.
What goes up must come down?
Unfortunately, prices don’t obey gravity. Threshold “participation” prices across a wide range of goods have surged creating widespread inflation anger even as wage growth has outpaced average prices for many Americans. Until inflation expectations are fully contained by more restrictive monetary policy, the pain is likely to increase. As Mr. Green points out, the design of fiscal policy has exacerbated the hurt as can be seen in the slowing growth of (after-tax) disposable income relative to (pre-tax) personal income since the Global Financial Crisis (Figure 5). President Trump has tried to address the latter with tax cuts on overtime and tips. But unless he addresses the “threshold creep” the Fed is accelerating, he’s likely to pay a significant price in the midterm elections next year. Reportedly, he’s hearing that message.88 If, as I suspect, he acts on that advice, market pricing of interest rates next year likely is significantly too low.


Comments are available to paid subscribers only.